DWT + ITM + SWO and MCU Cycle Counting
In this post, we’ll explore several powerful debugging and profiling tools available on ARM Cortex-M7 microcontrollers. Specifically, we’ll use the DWT (Data Watchpoint and Trace) unit to perform precise cycle counting, and send this timing information through the ITM (Instrumentation Trace Macrocell), which transmits it to the debugger over the SWO (Single Wire Output) interface. These features allow developers to measure algorithm execution times with minimal overhead, which is especially useful when optimizing performance-critical code like FFTs or control loops. Rather than a formal tutorial, this post serves as a working notebook of how I’ve implemented and used these features in real projects, with enough detail to help others get started quickly.
Note: Almost all of the code in this post were generated with the help of AI tools. I don't take credit it.
This debugging stuff was just a means for testing other code and I am recording what I used in this blog for future reference.
Printing Messages to the SWV ITM Data Console
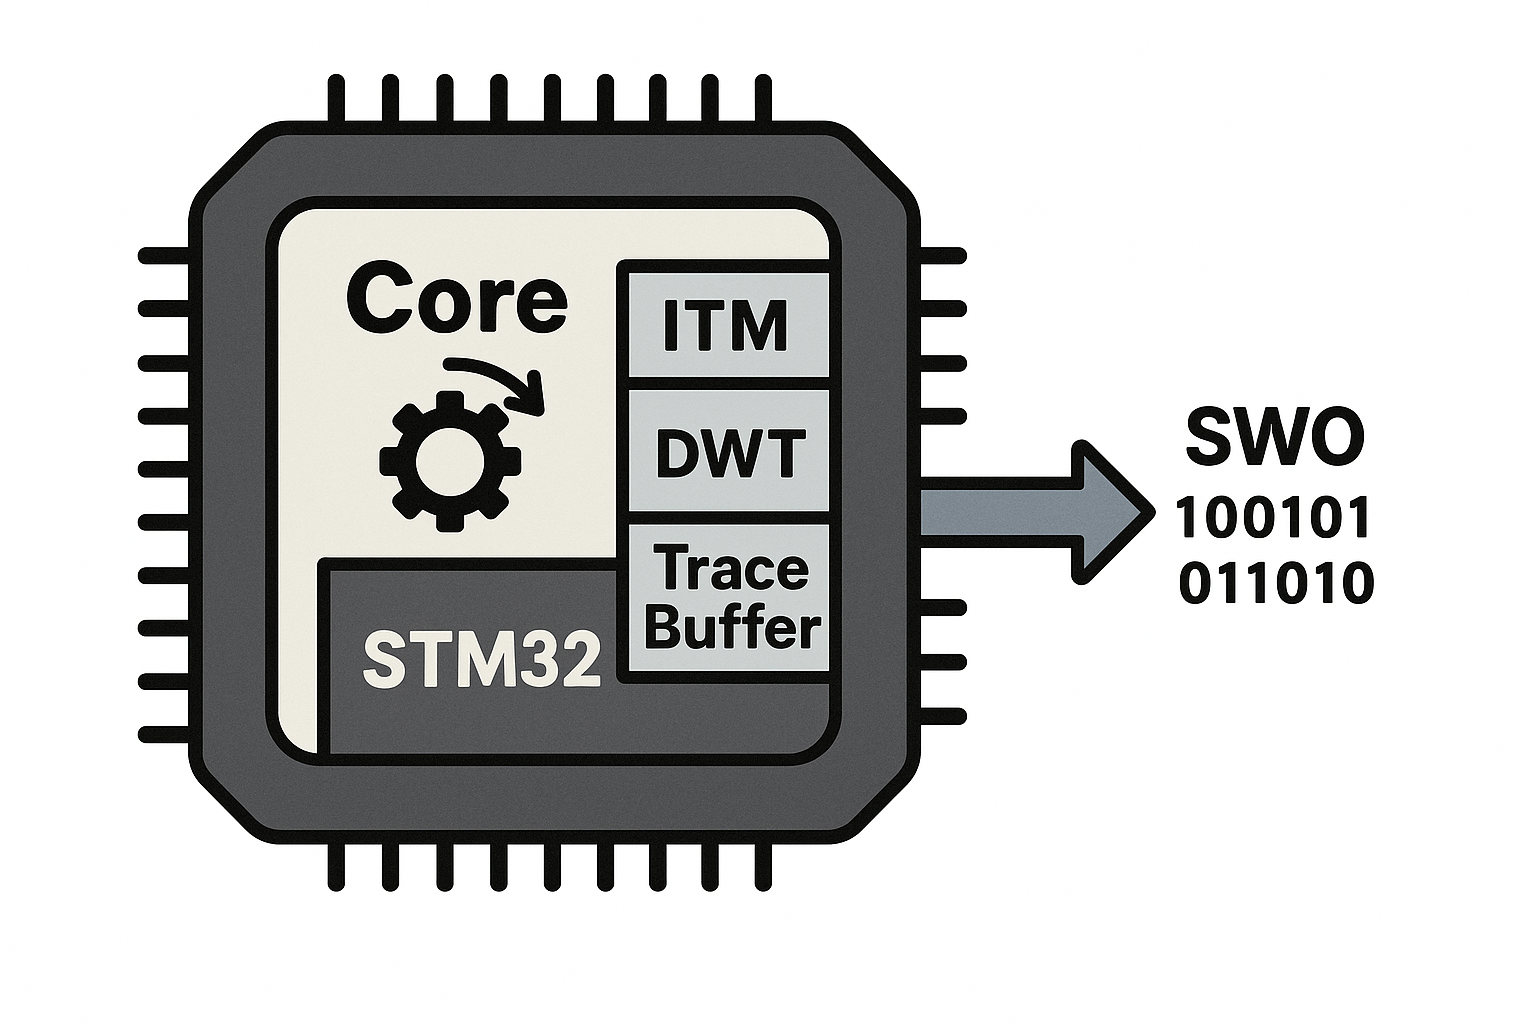
We can send low-latency, low-overhead debug data from the microcontroller to a debugger using the Instrumentation Trace Macrocell (ITM), a feature built into ARM Cortex-M cores. The ITM allows developers to transmit diagnostic messages, timing information, and other trace data without significantly interrupting program execution. This data is sent over the Serial Wire Output (SWO), a single-pin physical connection that is part of the ARM Serial Wire Debug (SWD) interface. The communication protocol used on this pin is called Serial Wire Viewer (SWV), which structures and timestamps the trace data for real-time analysis.
Compared to traditional UART-based debugging, ITM/SWO offers significantly higher throughput and much lower intrusion on CPU performance. While a typical UART might max out at 115200 or 1 Mbps, SWO can reach several megabits per second, depending on system clock configuration. More importantly, ITM can be used to emit lightweight events (such as function entry/exit or variable values) with just a few instructions, making it ideal for real-time debugging and profiling in embedded systems.
To implement this, first ensure that both your development board and debugger support the SWO (Single Wire Output) pin and that it is physically connected. On STM32 boards, the SWO pin is typically mapped to PB3 (or PA13, depending on the configuration), and your debugger (such as ST-Link, J-Link, or CMSIS-DAP) must support SWO output.
Next, in your code, include the necessary header to access the ITM and DWT registers:
#include <stdio.h>
Then, to enable printf( ) output through the ITM interface, we can add the following function. This overrides the low-level _write system call used by printf( ) and redirects its output to the ITM stimulus port using the ITM_SendChar( ) function. This allows you to use standard printf() statements in your code, and view the output through the SWV console in your debugger:
This function sends each character in the string one by one through ITM port 0. It assumes that ITM has been properly initialized and that SWO output is enabled in your debugger. Once set up, you can use printf( ) anywhere in your code, and the messages will be sent over the SWO pin with minimal performance impact. For example we can print “Hello” every second:
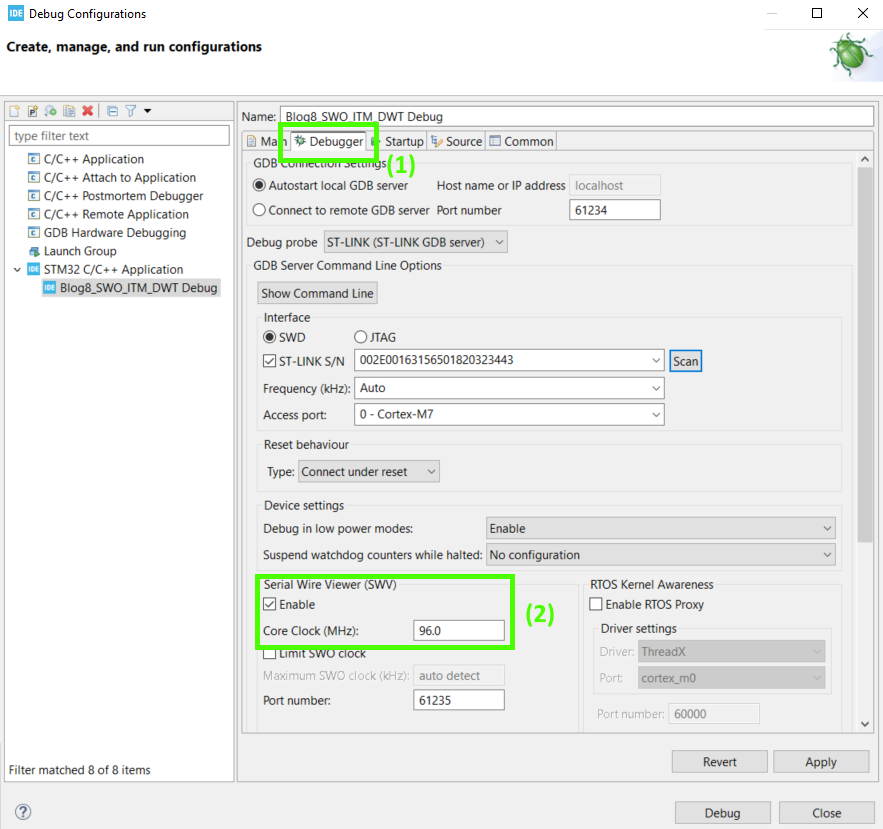
With this basic test code in place, we now need to configure the debugger to receive the SWV output. To do this, open your IDE’s Debug Configuration tool and navigate to the Debugger tab. In the Serial Wire Viewer (SWV) section, check the box labeled Enable to activate SWO tracing.
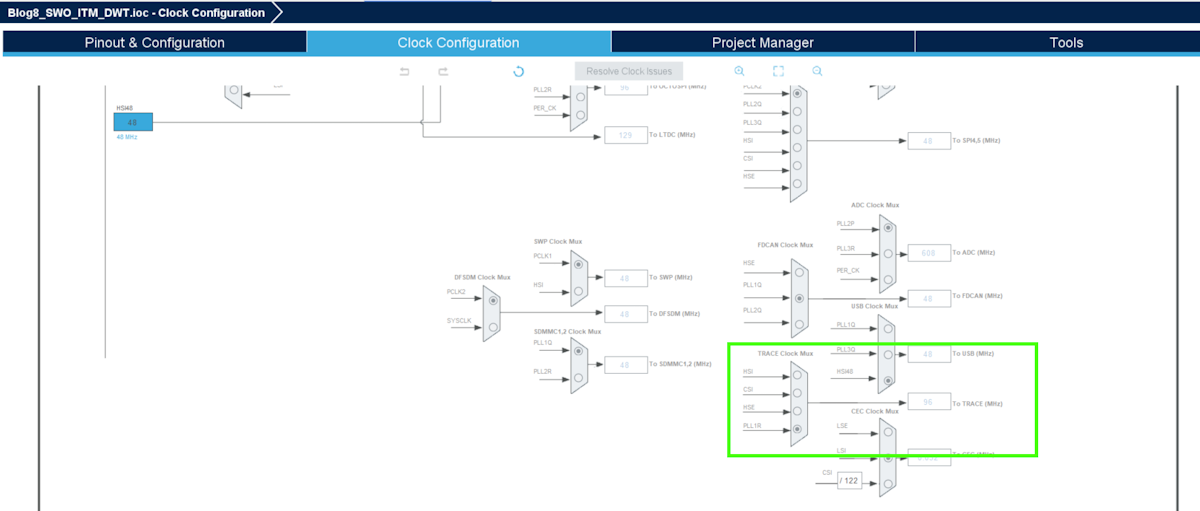
Next, set the Core Clock frequency field. On STM32H7 devices, this value must match the trace clock frequency, which is connected internally to the TRACECLKIN signal. This clock is not necessarily the same as the system core clock. In my case, TRACECLK is derived from PLL1R, which is running at 96 MHz, so that is the value I enter.
Note: You can verify or adjust the trace clock source in STM32CubeMX or by reviewing your clock tree configuration in code. An incorrect clock setting here will prevent the SWO data from being decoded correctly.
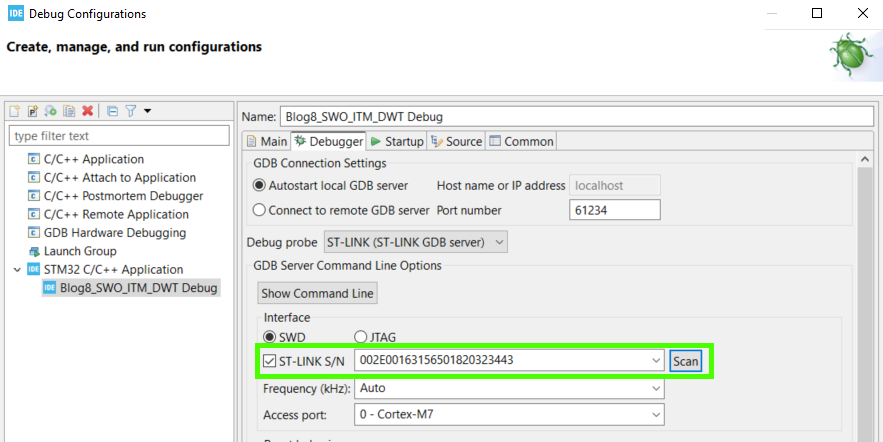
TIP: If you have multiple STM32s attached to your PC, you can specify which device to program by checking the ST-LINK S/N box and selecting the serial number of the board you want to program (use the Scan button to find the serial numbers).
Now that the debugger is configured, go ahead and start a debug session.
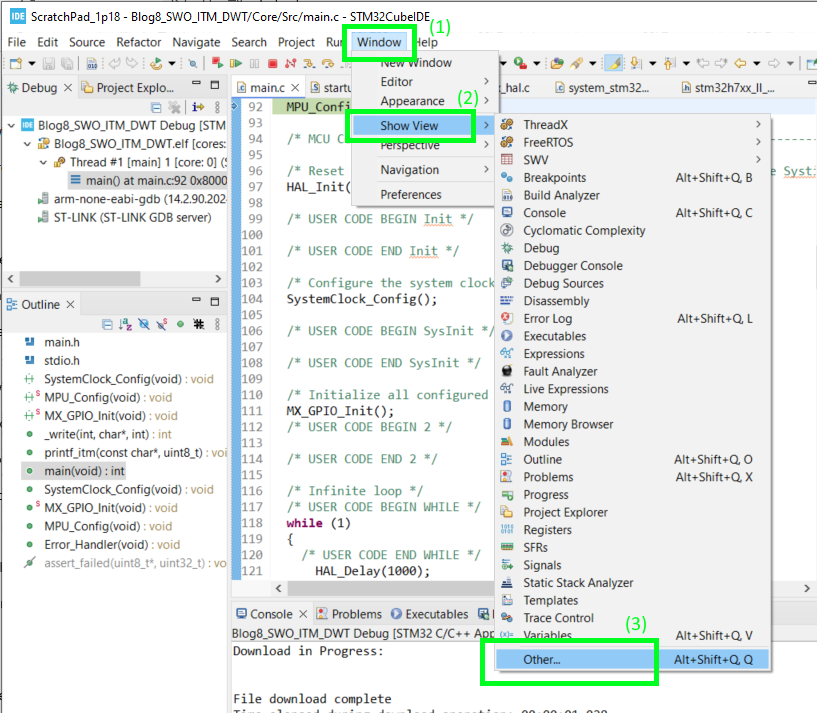
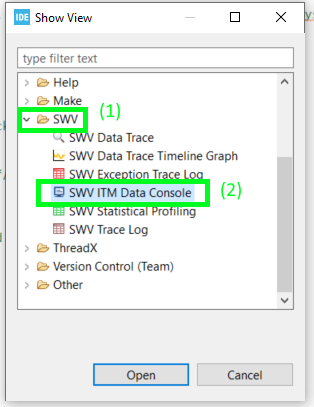
To view the printf() messages coming over SWO, open the SWV ITM Data Console. In STM32CubeIDE, you can do this by going to Window >> Show View >> Other… to open the Show View dialog. In this dialog, navigate to the SWV folder, expand it, and select SWV ITM Data Console.
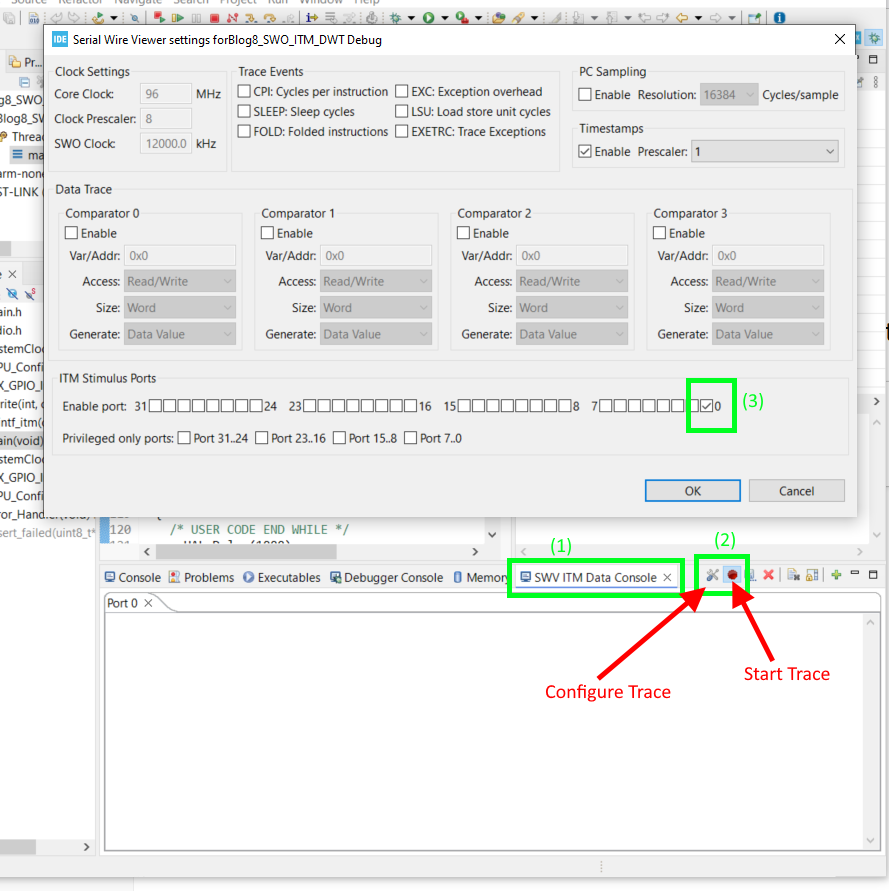
Next we need to configure the SWV. First we will click on the Configure Trace button and enable Port 0 of the ITM Stimulus Ports (the printf( ) function will use Port 0 by default). After that we will enable the Start Trace button.
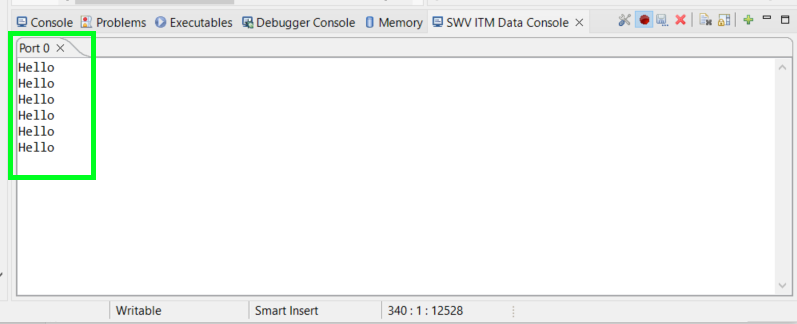
Run our code (the play button) and you should see the Hello message appear every second on Port 0.
Now suppose that we wanted to display some other data but on a different ITM Port. The current _write( ) function, which overwrites printf( ), only prints to Port 0 and we will leave it like this. We will instead create a new function called printf_itm( ) that will allow us to print data onto different ports:
And in our main loop we will call this function
printf_itm( message, portNumber);
Where message is our string that we want to print, and portNumber is the port that we want to print it to. In this example we will send the following:
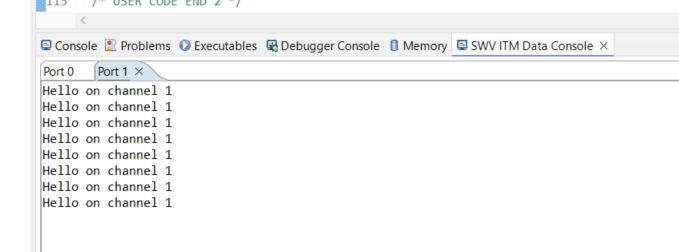
printf_itm("Hello on channel 1\n", 1);
With that we shall restart our debugging session and this time in our SWV ITM Data Console we will click on the Configure Trace button and also enable Port 1 of the ITM Stimulus Ports.
Now when we run our code we get the “Hello on channel 1” message.
If I wanted to print something more useful like the value of a integer to the SWV ITM Data Counsole, the printf( ) statement works as you would expect. For example:
printf("SystemCoreClock = %lu\n", SystemCoreClock);
Prints out the system clock frequency on Port 0.
However, the printf_itm( ) function as written is not as convenient. In theory you could change the function to work more like printf( ) but I am just going to manipulate a string (array of char) before sending it to the printf_itm( ) function as shown below:
Where counter is a variable starting at 0 and incrementing in the main while( ) loop.

Watching Variables with SWV Data Trace and Timeline Graph
Same setup as discussed in the last section. You do not need the _write( ) or printf_itm( ) functions for this.
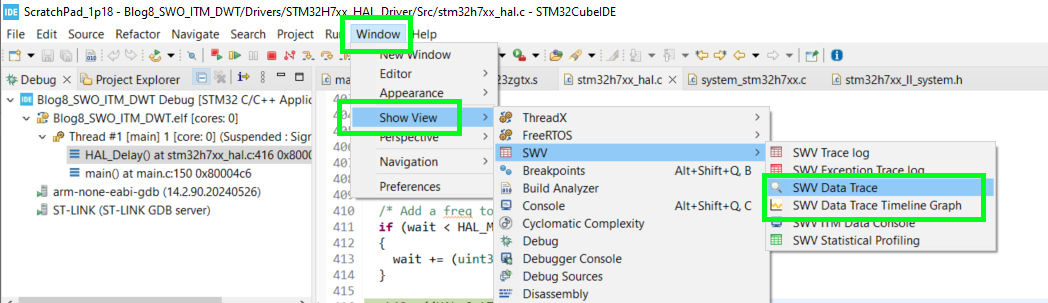
This time we will enable the SWV Data Trace and Trace Timeline Graph as shown below.
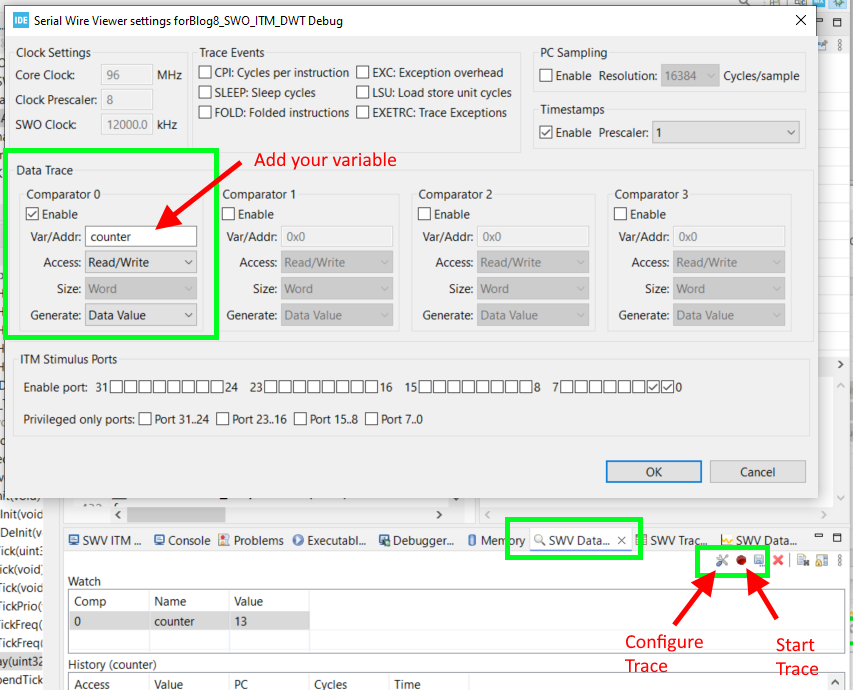
We need to configure the SWV. First we will click on the Configure Trace button and enable Comparator 0 in the Data Trace section. Then add your variable name (or address) to the textbox. After that we will enable the Start Trace button.
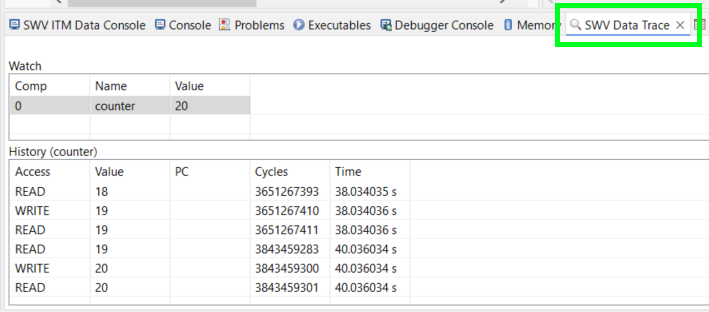
Now when we run our code, in the SWV Data Trace we can see the value of counter in real time as well as when either a read or write of this variable occurs.
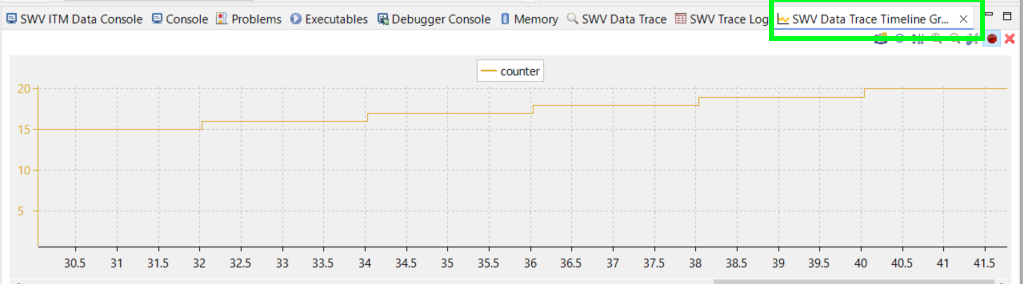
Similarly in the SWV Data Trace Timeline Graph, we can see how our variable counter changes over time.
MCU Cycle Counting
Another useful debugging tool is the ability to measure how many MCU clock cycles have elapsed during the execution of a section of code. This is especially valuable when optimizing algorithms for speed, as it allows you to measure performance in clock cycles rather than wall time. To achieve this, we’ll use the DWT (Data Watchpoint and Trace) unit, a built-in feature of ARM Cortex-M cores that provides precise cycle counting with minimal overhead.
To start we need to initialize the DWT using the following function:
And then we will call it after we have initialized all of our peripherals.
DWT_Init();
Now to use the DWT to count the number of clock cycles we will initialize a few variables to hold the start, end, and total number of cycles:
And then to use this we would do something like this:
After that we might use printf( ) into the SWV or just watch the dwtTotalTime variable in the Live Expressions tool.